Available widgets
The following widgets can be found under General:
- Rich Text widget
For adding static content, such as text and images - Project Stats widget
Displays an overview of your project's statistics - Link Panel widget
For adding automatically generated links within your project and creating manual links to e.g. external websites - Calendar widget
Adds a calendar to the dashboard - Device Stats widget
Displays an overview of your devices - Device Details
Displays the information from the configured information blocks - Duplicates widget
Displays an overview of duplicates occurring in input data and processed data - Tree widget
Displays data in a tree view - Table widget
Displays data in a table view - Location Map widget
Displays the exact location of a device in a map - Colored Tour widget
Displays a route of a device with the color of the line indicating the status of a specific factor, e.g., fuel consumption - Heatmap widget
Displays data on a map whose values are clustered and represented by colors - Friction Map widget
Displays colored squares that depend on the friction signal on a map - Filter widget
For adding search options to your project - Illustration widget
For adding images that can be provided with values - Playback widget
Provides up-to-date data on a dashboard - Value widget
Displays one or more values - Tab widget
For adding tabs to separate information - Action Button widget
Executes a REST request - Upload widget
For uploading files in dashboards - Input widget
For adding input masks to your dashboards
General functions
After the widget has been added to the dashboard, you have the following options:
These options are only displayed when hovering over the widget so that the widget itself is in the center of attention.
Refreshing a widget
Available for the following widgets:
- Project Stats
- Device Stats
- Duplicates
- Tree
- Table
- Location Map
- Colored Tour
- Heatmap
- Friction Map
- Illustration
- Value
- Input
- Upload
Proceed as follows
Click the Refresh Diagram icon ![]() to refresh the widget.
to refresh the widget.
→ The widget is refreshed.
Maximizing/minimizing a widget
Available for the following widgets:
- Project Stats
- Device Stats
- Duplicates
- Tree
- Table
- Location Map
- Colored Tour
- Heatmap
- Friction Map
- Illustration
- Value
- Input
- Upload
Proceed as follows
Click the Maximize/Minimize icon ![]() to maximize the widget.
to maximize the widget.
→ The widget is enlarged.
To minimize the widget, click the Maximize/Minimize icon ![]() .
.
Downloading a widget
Available for the following widgets:
- Tree (CSV/JSON)
- Table
- Location Map
- Colored Tour
- Heatmap
- Friction Map
- Illustration
- Value
- Input (JSON)
- Line chart (CSV/JSON)
- Bar chart (CSV/JSON)
- Heatmap chart (CSV/JSON)
- Scatter Plot chart (CSV/JSON)
- Treemap chart (CSV/JSON)
- Signals chart (CSV/JSON)
- Pie chart (CSV/JSON)
Proceed as follows
- Click the Download icon
 to download the data of a widget.
 Open or save the file to the desired location.
→ The widget data has been downloaded.
If the CSV/JSON download is possible, proceed as follows:
- Click the Download drop-down list to download the data of a widget as CSV or JSON.
- Select either JSON or CSV.
→ The widget data has been downloaded.
Additional functions of filter widgets
Sharing the filter url
After the widget has been added to the dashboard and its sharing option has been enabled in the widget's configuration editor, you have the following sharing options:
Proceed as follows
- Click the
 icon from the filter's header bar.
 - On the dialog that opens, select the user(s) with whom you want to share (i) the filter and respectively (ii) the entire dashboard on which the filter is added.
- Select one of the available sharing options: Copy url, Share via Teams, or Share via Mail.
Please, note that the roles of these users will affect their view of the shared content. They may see different content or even no content at all.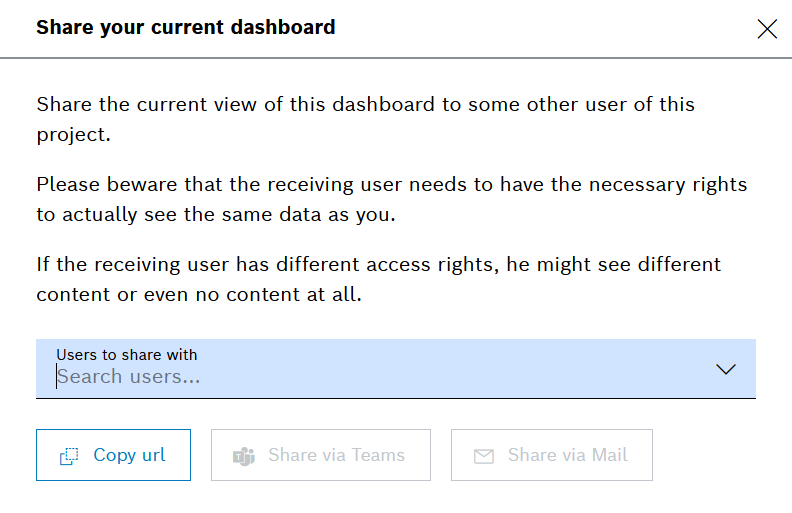
- If you choose Copy url, you can paste the url directly to the user(s) through your channel of choice.
- If you choose Share via Teams, the system will automatically start a draft Teams message for a single user, or will start a draft group chat between you and the multiple users, with a pasted link to the dashboard. Then, you need to send the message.
- If you choose Share via Mail, the system will start an Outlook email draft with prefilled email address(es) and a pasted link to the dashboard. Then, you need to send the email.
Enabling the facet search
The filter widget supports device filtering with facet-based data. This allows you to see the number of matching records for each filter and thus make filtering more targeted and intuitive.
There are a number of different steps involved:
- In the first place, you need to have a suitable facet search-related query template with parameters and a specific template definition.
Such a query template will only return the available filters and the number of matching results. For comparison, a regular query template will return the results themselves.
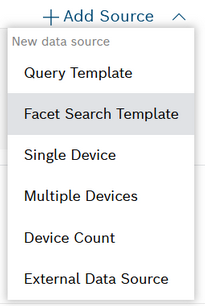
- Then, you need to select this query template as a data source in the filter widget, however, choosing the dedicated type for Facet Search Template.
- Then, you need to add a General filter(s), and in their Advanced settings to activate the checkbox for Facet search field (see the last checkbox on the screenshot below).
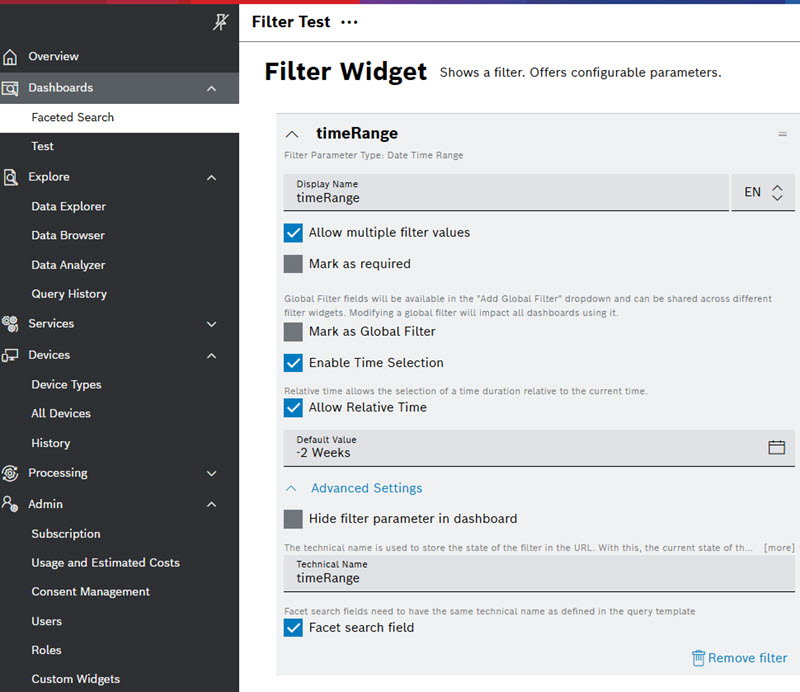
- Finally, you will use these global filters as a reference in the data source parameters of the respective other widgets on the dashboard, e.g. in a table widget which displays the actual filtered data.
You can find more details in Tutorials > Configuring the faceted search and Examples > Query templates: Faceted search.
Additional functions of map widgets
After the widget has been added to the dashboard, you have the following options:
Changing the map style
Available for the following widgets:
- Location Map
- Friction Map
- Heatmap
- Colored Tour
Proceed as follows
- Click the Map Style icon
 .
. - Select one of the offered map styles.
→ The map style is changed according to the map style you selected.
Zooming in/zooming out
Available for the following widgets:
- Location Map
- Friction Map
- Heatmap
- Colored Tour
Proceed as follows
Click the Zoom in icon ![]() to zoom in.
to zoom in.
Click the Zoom out icon ![]() to zoom out.
to zoom out.
Resetting bearing to north
The map can be positioned back so that north is displayed at the top.
By holding down the right mouse button and moving the mouse, the map can be turned in all directions.
Available for the following widgets:
- Location Map
- Friction Map
- Heatmap
- Colored Tour
Proceed as follows
Click the Reset bearing to north icon ![]() to have the north displayed at the top.
to have the north displayed at the top.
Adding and removing location marks
Available for the following widgets:
- Location Map
- Friction Map
- Heatmap
- Colored Tour
Proceed as follows
- Click the Location Mark icon
 to add a location mark to your map.
 Move the location mark to the desired location on the map.
→ The location mark is set.Location marks are not stored for the next sessions.
Click the Delete icon
 to delete the set location marks.
Displaying data points
Available for the following widgets:
- Heatmap
- Colored Tour
Proceed as follows
- Click the Data Point icon
 to activate the display of data points on the map.
 - Click any of the data points to have the latitude and longitude displayed.
Additional functions of playback widgets
After the widget has been added to the dashboard, you have the following options:
Skipping to the beginning
Proceed as follows
Click the Skip to Beginning icon![]() to restart the playback.
to restart the playback.
Rewinding
Proceed as follows
Click the Rewind icon ![]() to rewind the playback.
to rewind the playback.
Playing the widget
Proceed as follows
Click the Play icon ![]() to start the playback.
to start the playback.
Fast forwarding
Proceed as follows
Click the Fast Forward icon ![]() to fast forward the playback.
to fast forward the playback.
Skipping to the end
Proceed as follows
Click the Skip to End icon ![]() to skip to the end of the playback.
to skip to the end of the playback.
Setting the playback speed
Proceed as follows
- Click the Playback Speed drop-down list
 .
. - Select one of the provided playback speeds.
→ The playback speed is changed according to the playback speed you selected.
Additional functions of calendar widgets
Creating a booking
Refer to Creating a booking.
Editing a booking
Refer to Editing a booking.
Removing a booking
Refer to Removing a booking.
Additional functions of table widgets
Generating personal reports
You can generate personal reports containing filtered data from a table widget with selected frequency. Whenever a personal report is generated, you will receive an email notification with a quick link to the report in the UI.
Find out more at Personal reports.