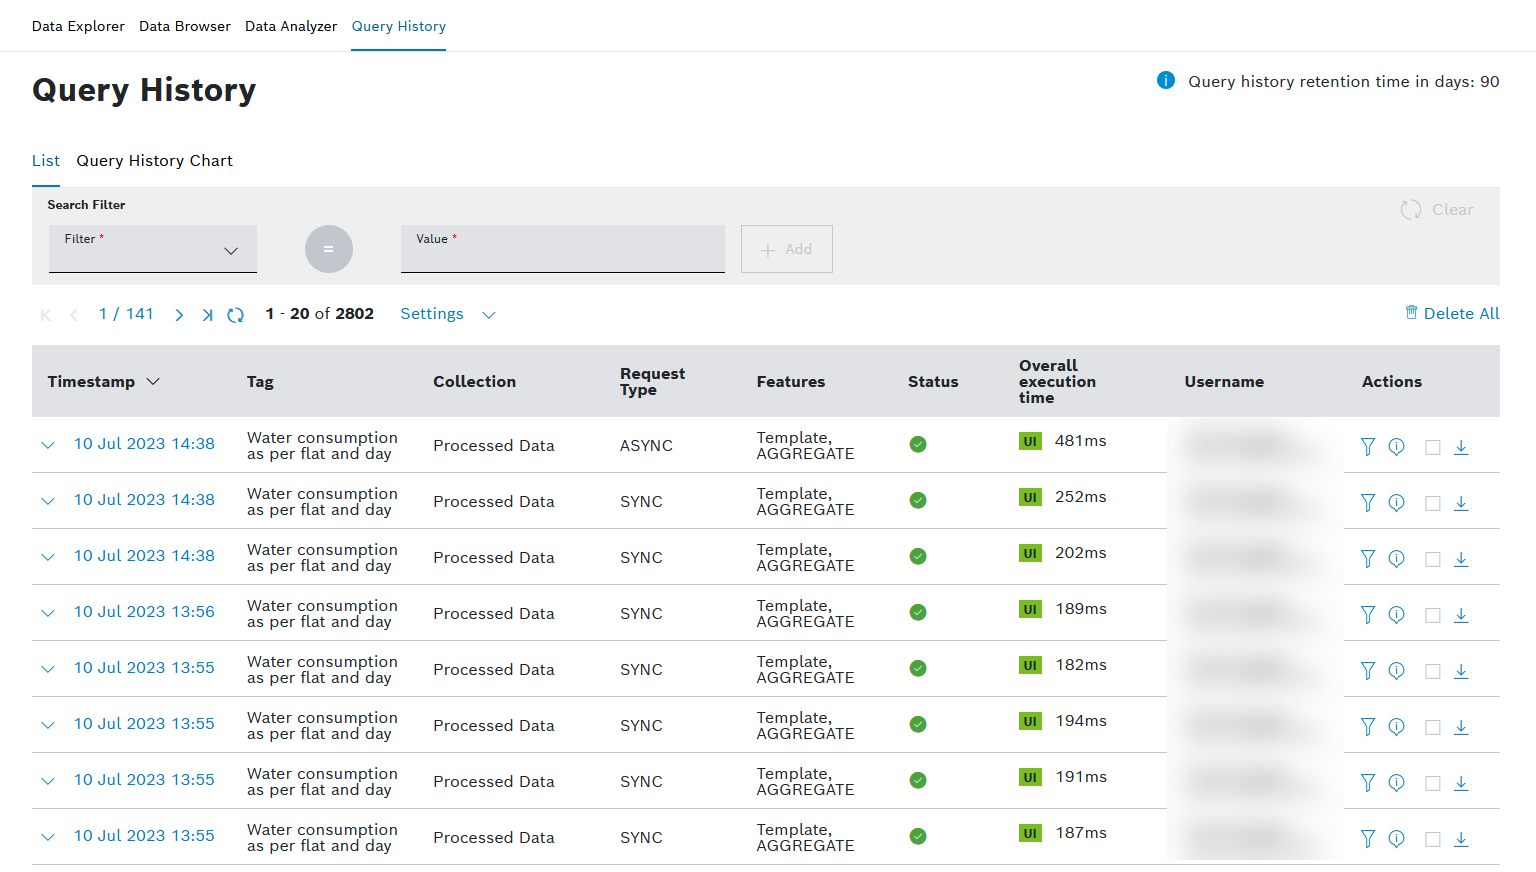
The Query History lists all user-specific queries along with their details.
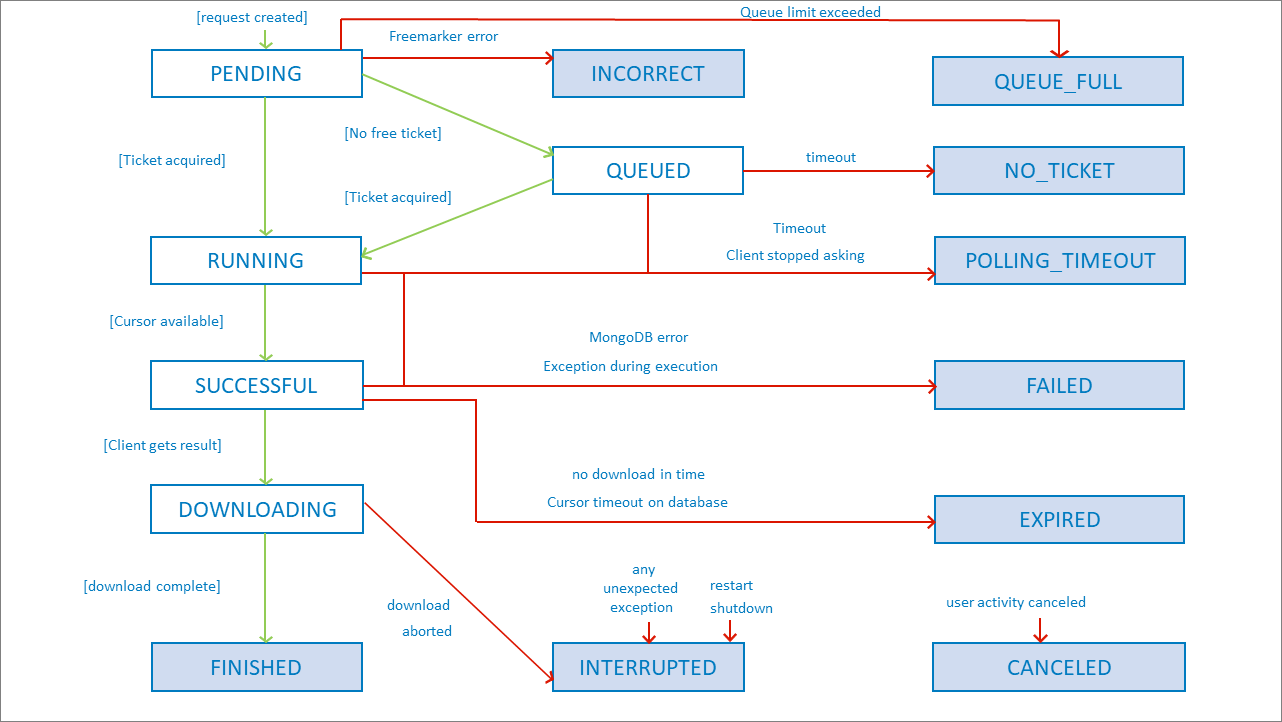
The following query statuses exist:
Icon | Status | Description |
|---|---|---|
Pending | The query request is waiting to be handled. | |
Incorrect | The query failed due to incorrect syntax or missing information. | |
Queued | The query is waiting for a read ticket to become available. | |
Polling Timeout | The frequent query status request of the client was aborted (e.g. when tab with the dashboard is switched or closed) | |
Running | The query was sent to the database and is executed, waiting until the the data is available. Remains in this state until the query result is downloaded. The ticket is occupied in this state. | |
Downloading | The download of the query result has started and is in progress. | |
Failed | The query execution failed due to an unforeseen error or a database exception. | |
Successful | The query result is ready to be downloaded (DB cursor is ready). The ticket is occupied in this state. | |
Expired | The query result was not downloaded by the client in the pre-defined time frame. | |
Interrupted | The download of the query result failed, was aborted, or interrupted. This may be due to network issues or other unforeseen infrastructure problems. | |
Finished | The query result was downloaded completely and the query is finished. | |
Canceled | The query got manually canceled before it was finished. | |
| No Ticket | No free read ticket available. If this error state occurs too often, check the read ticket duration in case there are long-running queries that can be optimized. You can also increase the amount of read tickets. Refer to Basic Settings. |
Queue Full | If the maximum amount of read tickets has been reached, the follow-up query requests will be queued. The amount of read tickets that are queued depends on the number of read tickets you have booked times a factor If you have 3 read tickets booked, 15 query requests can be queued. Query requests above that limit will be denied. |
The following image shows when which query status is reached:
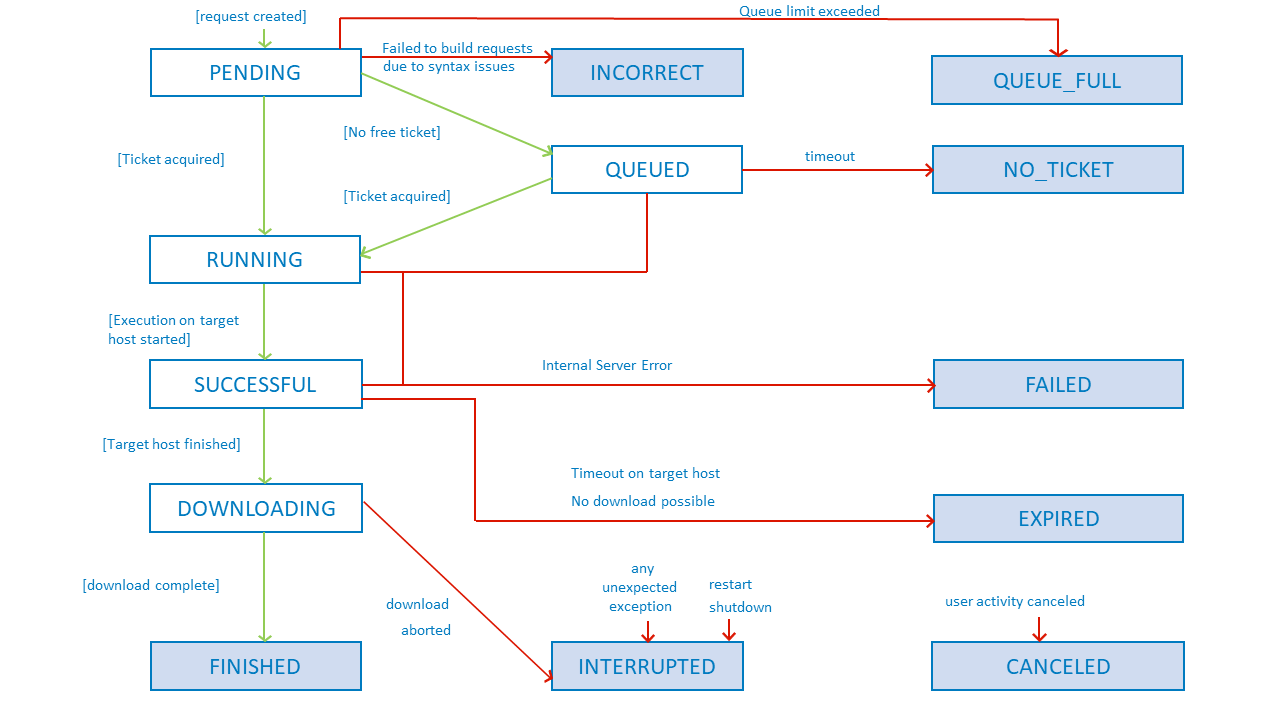
The following image shows the statuses for REST requests:
Legend:
Queries that are in state Running can be canceled by an Admin with the Cancel query icon . Canceled queries cannot be resumed!
Prerequisites
To execute the following actions, you have to be assigned to the User role or higher.
Proceed as follows
Click the Query History menu item.
→ The Query History is displayed.Open any query in the Query column to view the whole query and the details.
- The Cursor Preparation is the time it takes for the MongoDB cursor to be available.
This time is highly influenced by the query logic and complexity, e.g. if the query is written without any usage of indices, this will highly increase the cursor preparation time. - The Wait Duration defines the time how long it took the client to start retrieving the first bytes after they were available.
This timing is highly influenced by network infrastructure and client side application logic, which can lead to large variations on the numbers, e.g. if the client network connection has a bad latency the wait time can increase significantly. - The Download Time defines the time it took the client to retrieve all content.
This timing is highly influenced by network infrastructure, client side application logic, and also server side computations, which can all lead to large variations on the numbers, e.g. if the client network connection has a bad download speed the download time can increase significantly. - The Read Ticket Duration represents the sum of all others and stands for the time how long the service was occupied with the client request.
During this time resources were reserved for the client. - The Queuing Time refers to the time that was necessary to wait for a free read ticket.
- The Cursor Preparation is the time it takes for the MongoDB cursor to be available.
General functions
Filtering the query history
Proceed as follows
- Click the Add Filter drop-down list.
- Select a filter category.
→ A dialog is displayed in which you can define the filter. - Click the Save button.
→ The filter is applied to the query history.
Opening the query in the Data Analyzer
Proceed as follows
Click the Data Analyzer icon .
→ The query is displayed in the Data Analyzer.
Explain & Analyse
Proceed as follows
Click the info icon .
→ The query is displayed with the query results in the Data Analyzer. Refer to Analyzing a query.
Downloading the result
Prerequisites
You have activated the result caching under Advanced Settings in the Template Designer, refer to Creating a query template.
Proceed as follows
Click the download icon .
→ The result is downloaded.
Paging
Proceed as follows
Use the and icons to jump to either the first page or the last page of the displayed data.
Use the and icons to go back a page or forward.
Refreshing the entries
Proceed as follows
Click the icon to refresh the entries.
Limiting the number of displayed entries
Proceed as follows
- Click the Settings drop-down list.
- Select the number of processed data entries to be displayed per page.
→ The number of displayed entries per page is adjusted accordingly.
Deleting the query history
Click the Delete All button to delete the query history.


