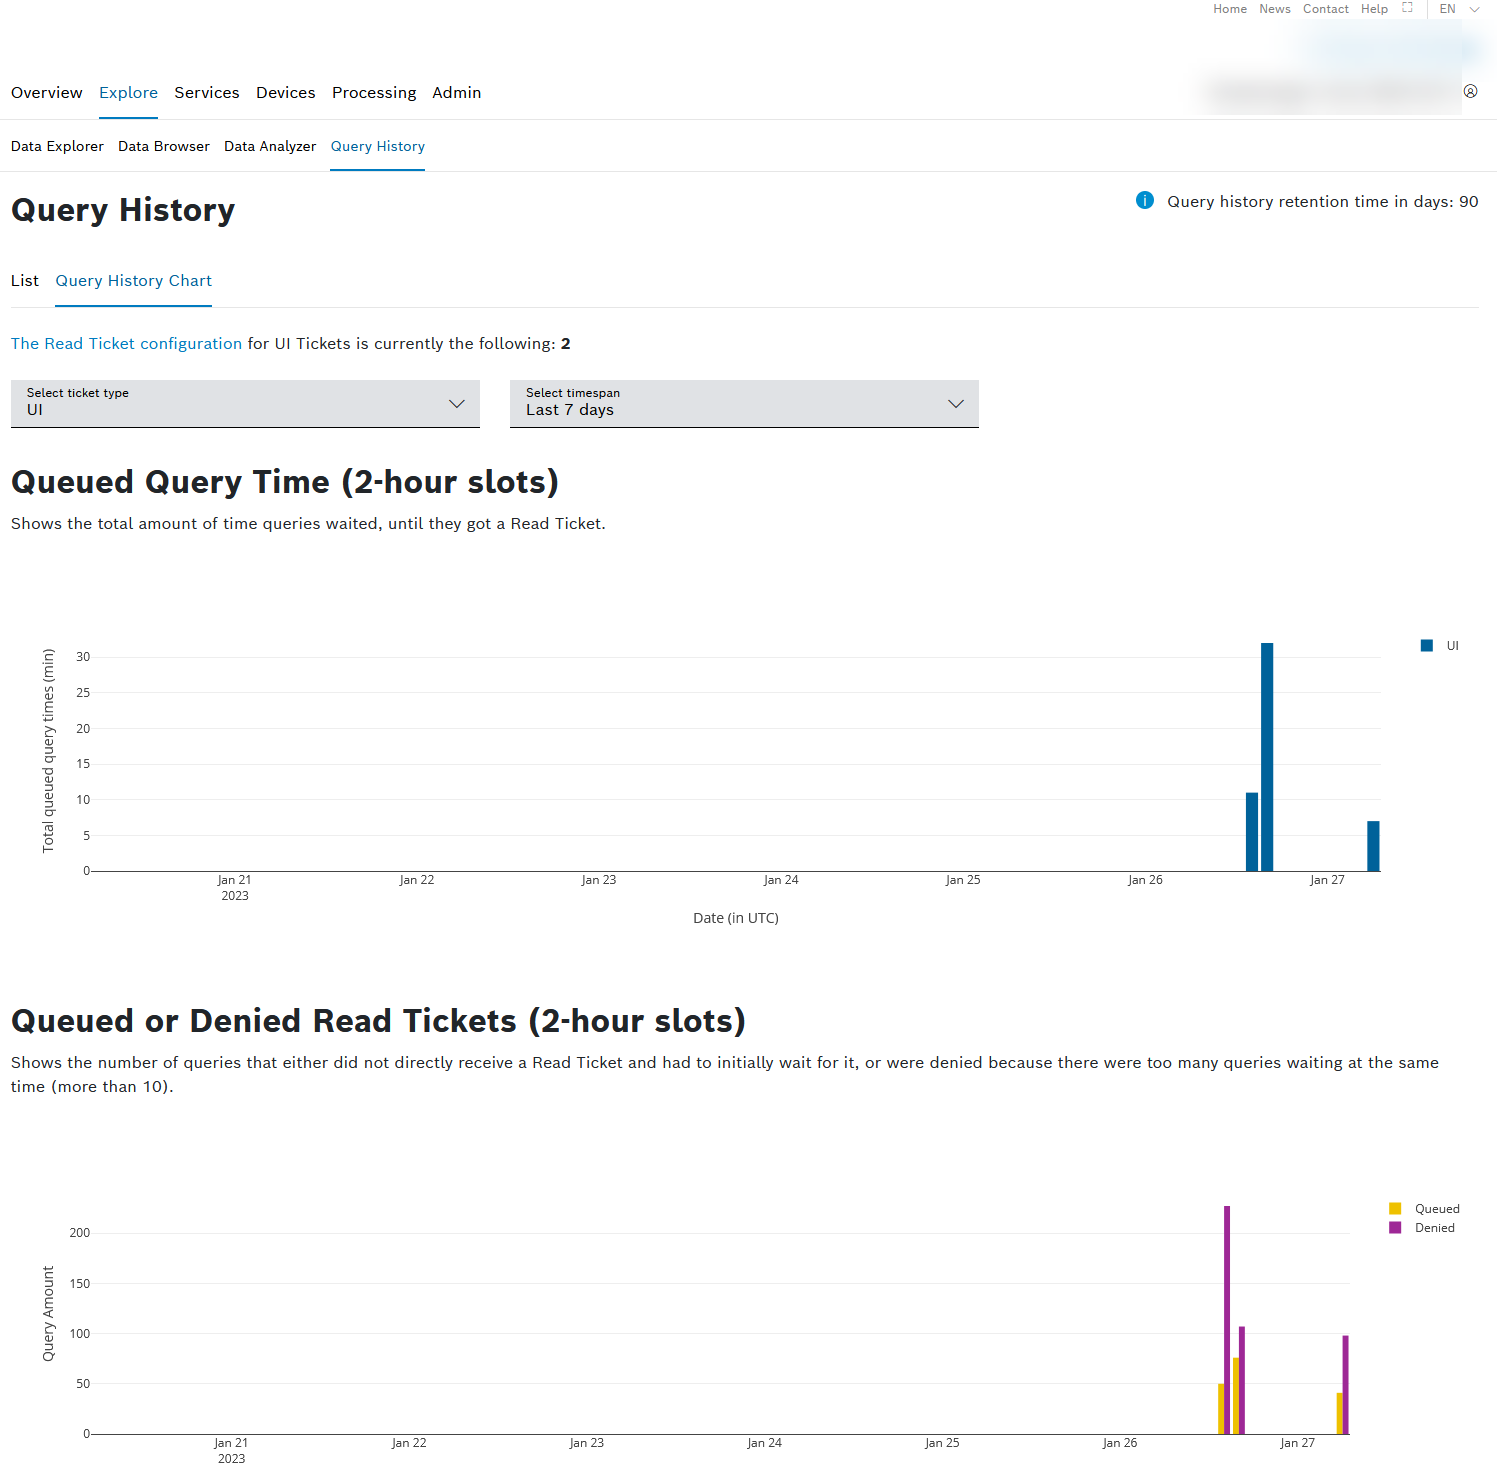
The Query History Chart provides an overview of the queued query time, the number of queries which had to wait for a read ticket as well as the ones that were denied. That way, you can easily check for bottlenecks or peaks in your queries and, if necessary, increase the number of read tickets.
The queued query time chart displays the time a query had to wait until a read ticket was available.
The queued or denied read tickets chart displays the number of queries that had to wait for a read ticket and also the number of queries that were denied due to too many queries waiting at the same time.
To find out more about read ticket management concepts, refer to Read Ticket Management.
Proceed as follows
Click the Query History Chart menu item.
→ The Query History Chart is displayed and shows two charts on the queued query time and the queued as well as denied read tickets.
Prerequisites
To access the query history chart, you have to be assigned to the Admin role.
General functions
Filtering the query history chart
Proceed as follows
- In the Select ticket type drop-down list, select the ticket type of which information shall be displayed in the charts.
- In the Select timespan drop-down list, select the time span for which the data shall be filtered.
Increasing the read tickets
Proceed as follows
- Click the Read Ticket configuration link at the top of the page.
→ You are navigated to Admin > Project > General Settings. - Adjust the amount of read tickets as described in Basic Settings.