In the Template Runner, the query result can be visualized as a chart and saved as a widget to a dashboard. The query template is used as the data source.
Prerequisites
You have created at least one query template in the Template Designer, refer to Creating a query template.
Proceed as follows
In the Data Explorer, select the desired query template whose query result shall be visualized.
→ The Template Runner is displayed.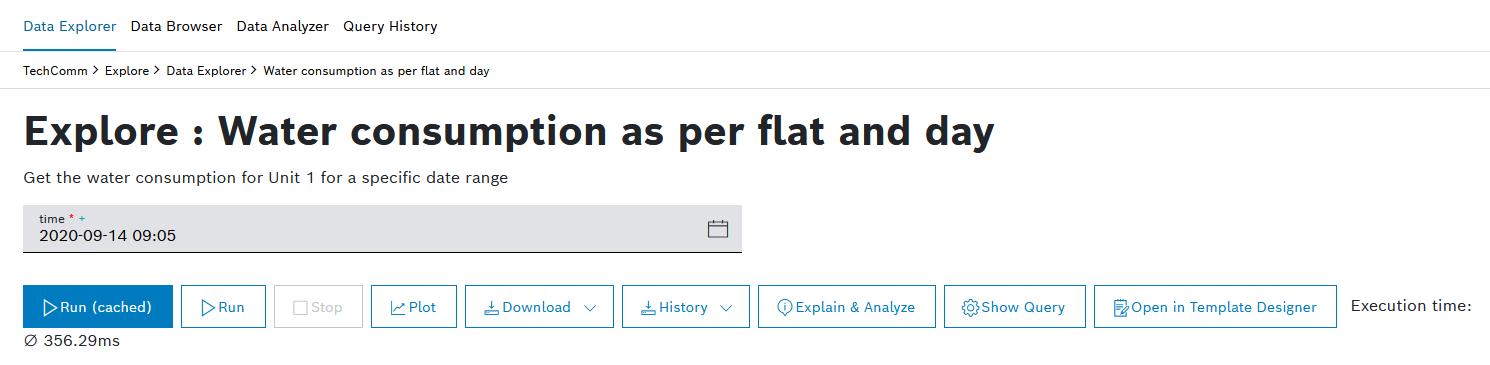 You can also visualize the query result in the Template Designer after you have created it. The Template Runner will be displayed underneath.
- Click the Plot button to visualize the query result in a chart.
→ The chart configuration is displayed.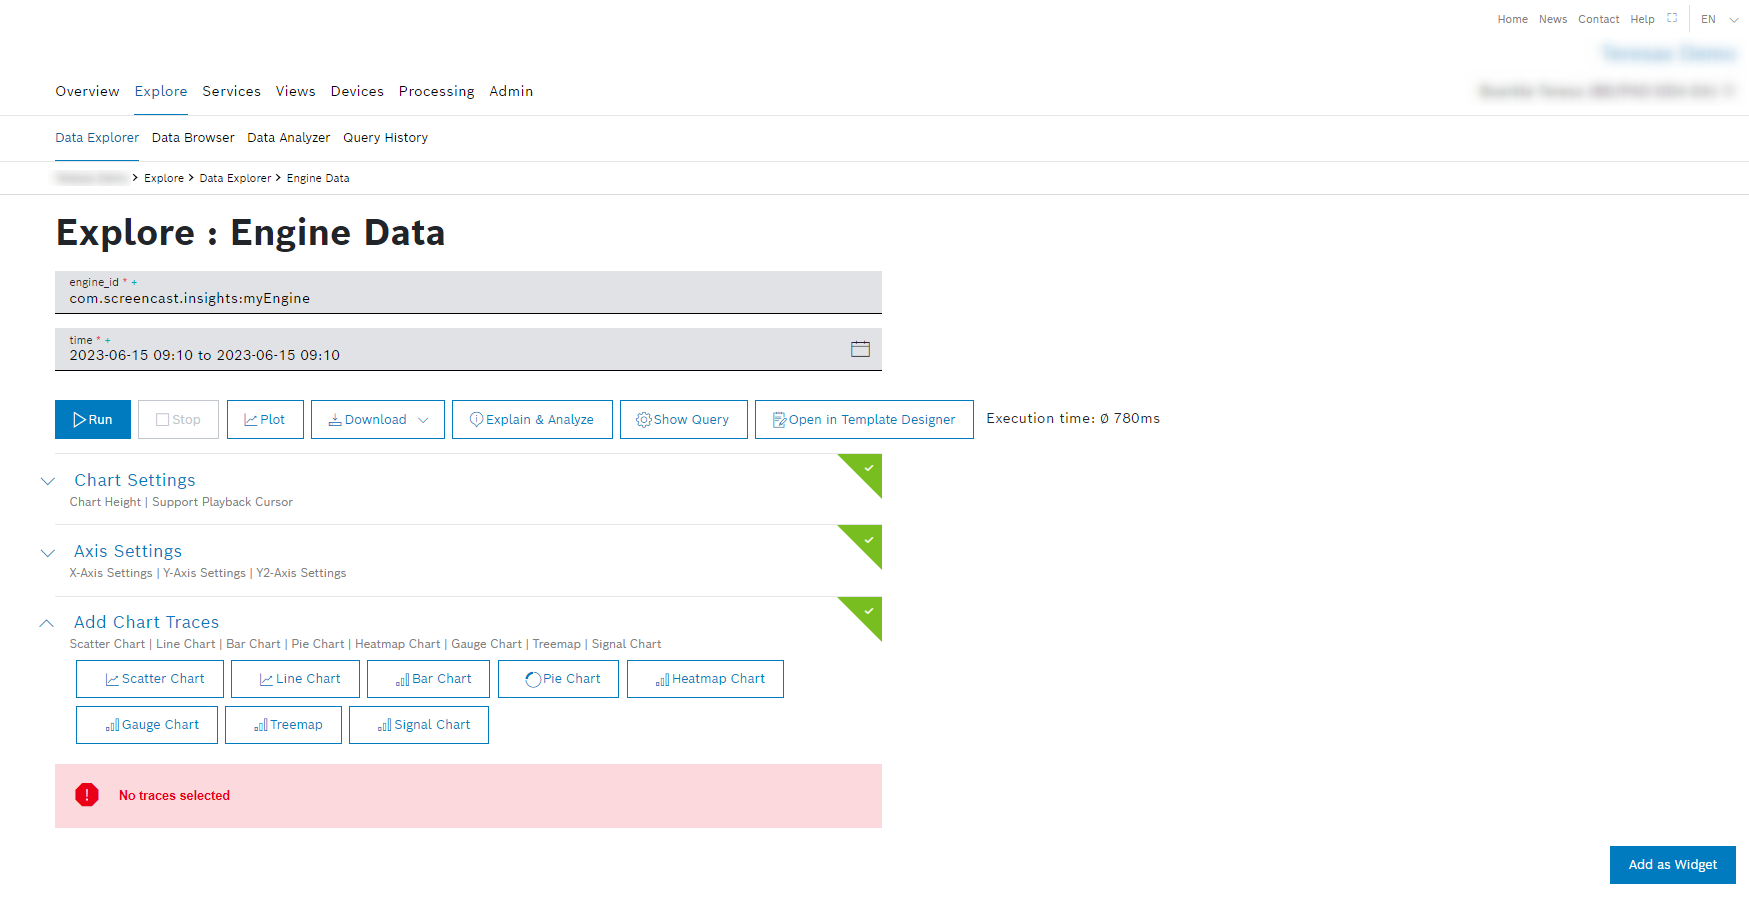
- Configure the chart as described in the following chapters:
→ A preview of the configuration is displayed on the right.
By clicking the Add as Widget button, the widget configuration page in Views is displayed. Configure the widget as described in the chapters above and save it to your dashboard.