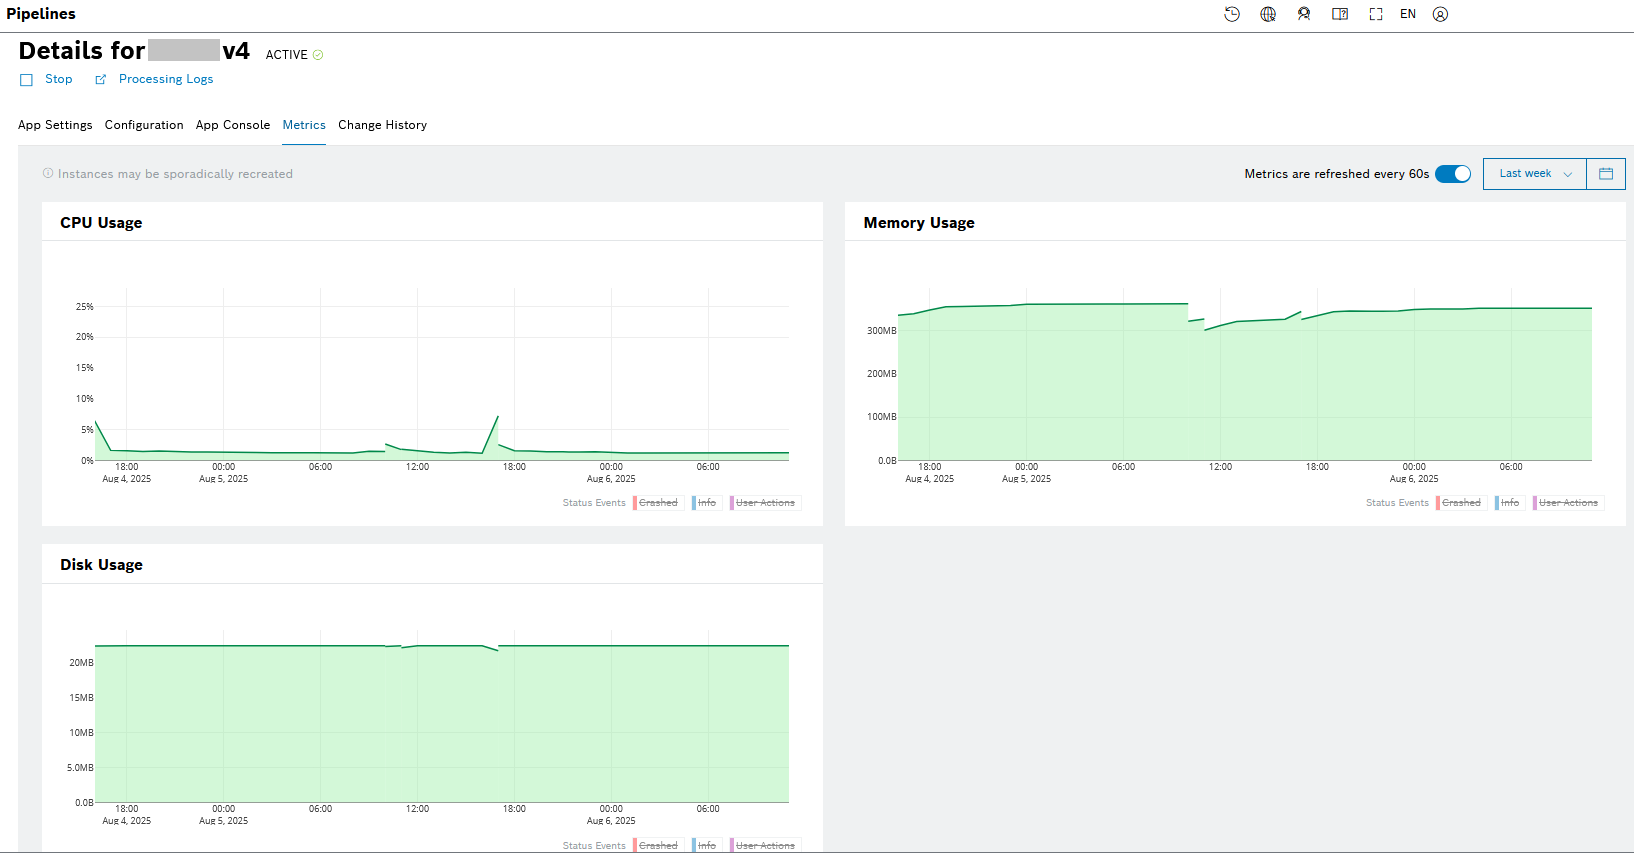
In the pipeline's Metrics tab, you can see the specific resource consumption of the pipeline over a period of time. In addition, you can also find information about Status Events and User Actions.
You can monitor the following usage categories:
- CPU Usage %
- Memory Usage
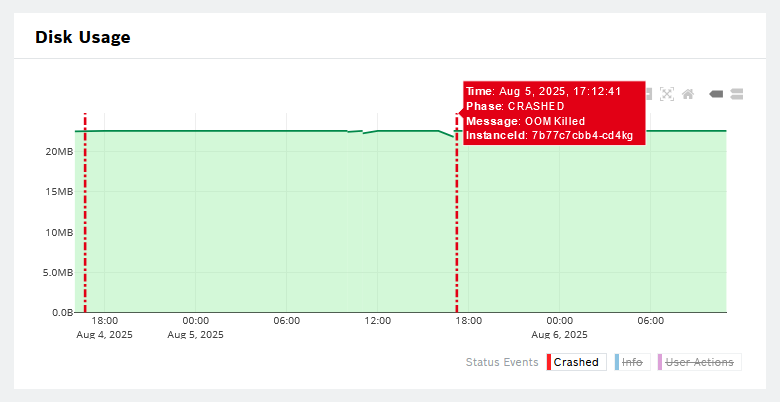
- Disk Usage
Be aware that instances may be sporadically recreated. The different instances are reflected with different lines on the chart and each instance has its unique ID.
When you start a pipeline, it may take some time for the first results to be displayed. The shorter the selected period, the faster you will see the charts.
Proceed as follows:
- Use the toggle if you need to pause the automatic 60-second refresh of the metrics or respectively to enable it again.
- Use the dropdown list or the calendar menu to define a relative or a more fine-grained period for the metrics report.
- Click the color flags in the legend to hide and display again the respective Status Events (Crashed and Info) and User Actions directly on the chart.
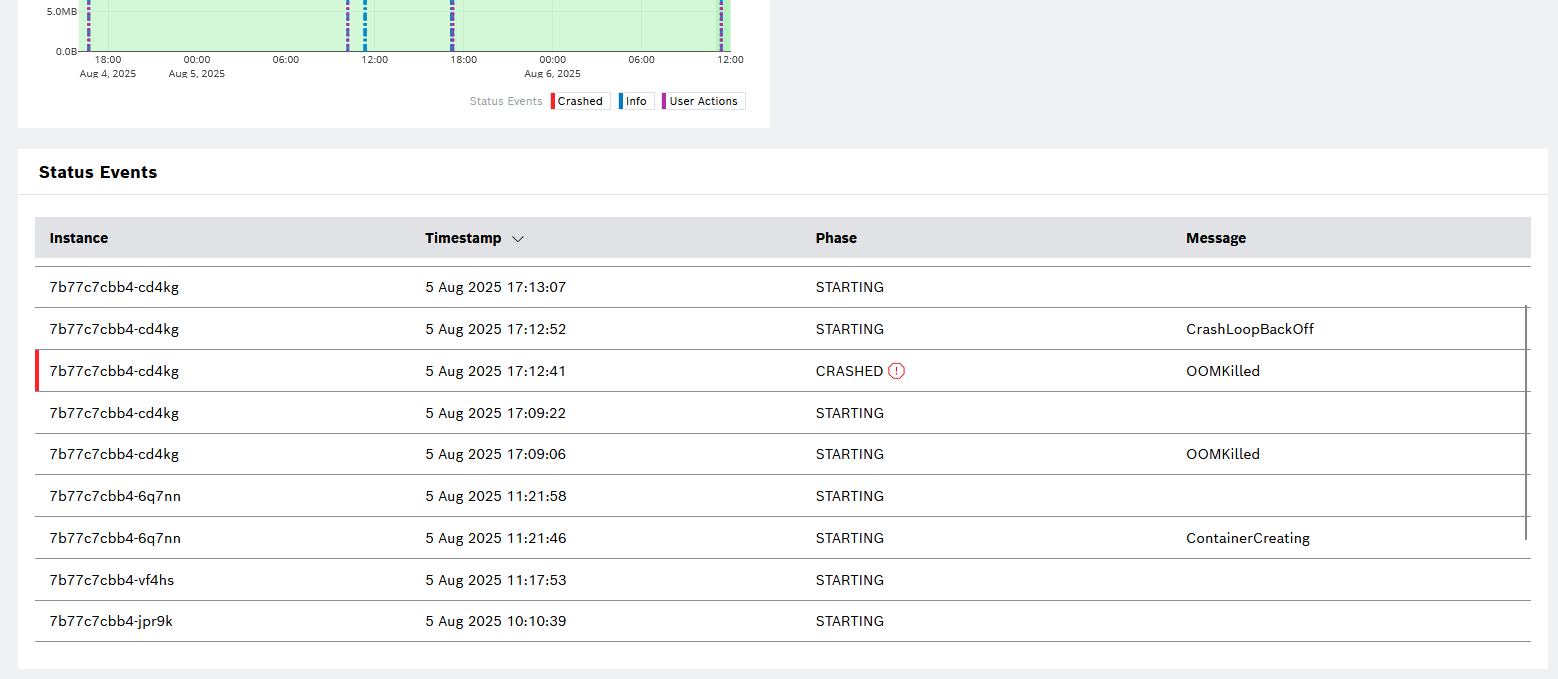
Status Events and User Actions
The user actions include the Start and Stop of a pipeline by a user and correspond to a certain pipeline app status, e.g. STARTING and STOPPED, as described in Pipeline App statuses. They are displayed directly on the usage charts.
The status events are listed in a table under the usage categories. These are infrastructure-level events which also correspond to a certain phase of the pipeline and provide some description of what has happened. The Crashed event is displayed separately on the usage charts, whereas the rest of the events are grouped in the Info category on the charts.
Proceed as follows:
- Click the color flags in the legend to hide and display again the respective Status Events (Crashed and Info) and User Actions directly on the chart.
- Hover over the top of the respective line to see more information about the event or action.