To display the relevant data out of all the ingested data, you can create suitable widgets on a dashboard.
Create a dashboard
- On the left navigation, go to Admin > Dashboards and click
 Add Dashboard in the upper right area.
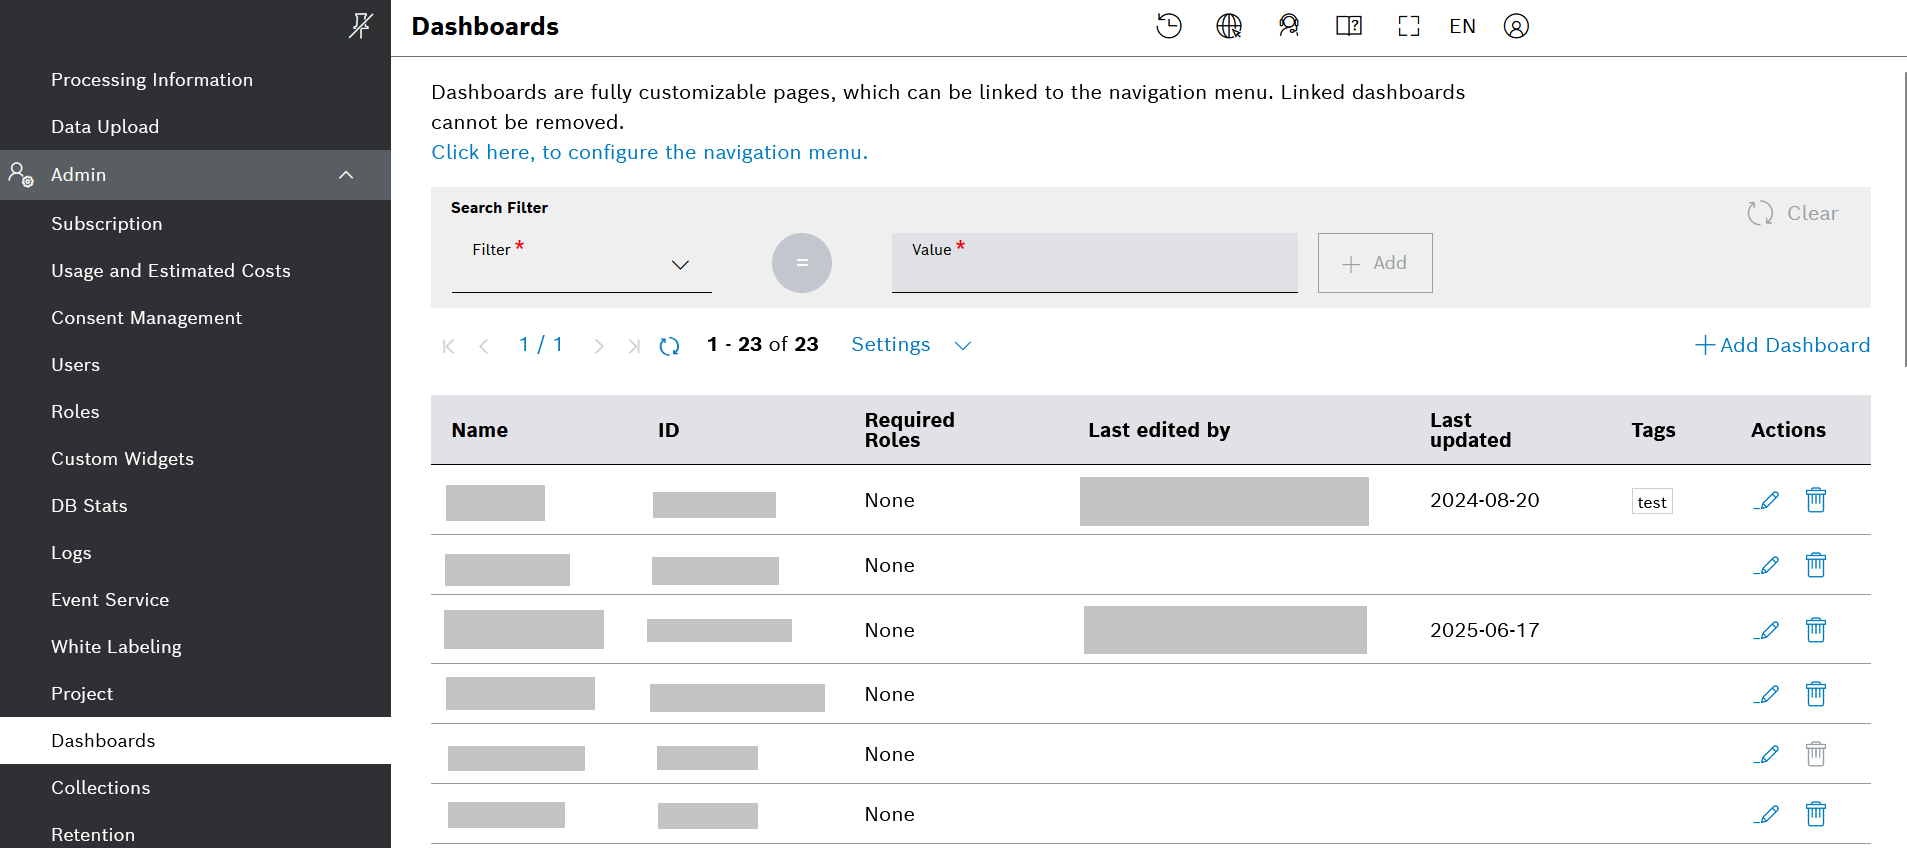
- On the dialog that opens, fill in the required fields and click the Save button. In our example, we will name the dashboard Fleet data.
→ Your new dashboard is ready and you can add widgets to it.
Add widgets
- On the list of dashboards (see screenshot above) go to the ID column and click the ID (hyperlink) of your new dashboard.
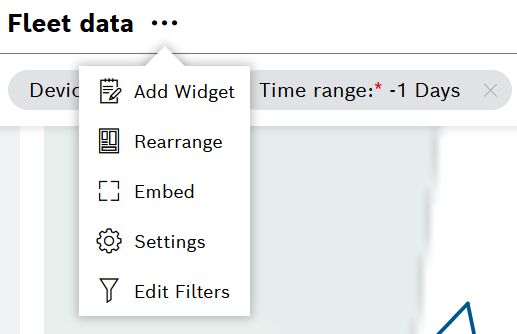
→ The dashboard opens. - Click the options icon next to the dashboard name and select the Add Widget option.
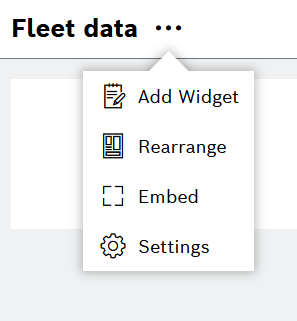
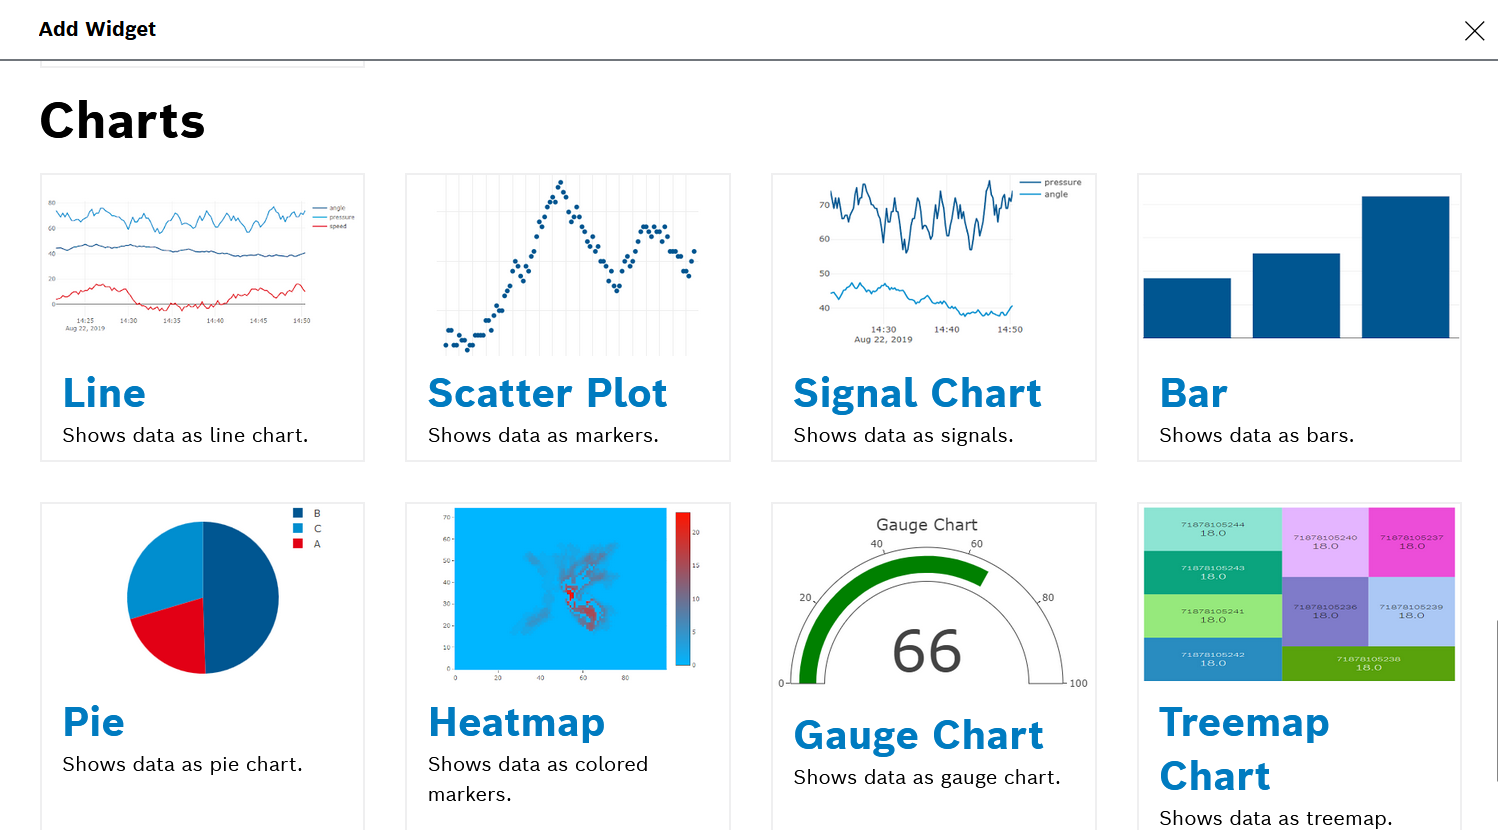
- Select the relevant widget type in the General or Charts category.
Add a Filter widget
Let's first add a Filter widget.
- On the dashboard options, click the Add widget option and select Filter widget.
- In the configuration editor that opens, fill in the required details in each section.
- In the Dashboard Settings section, optionally add a title for the filter.
- In the General Settings section:
- Keep the default values and especially the Sticky Display mode in order to have the filter widget always on top of the dashboard even when scrolling:
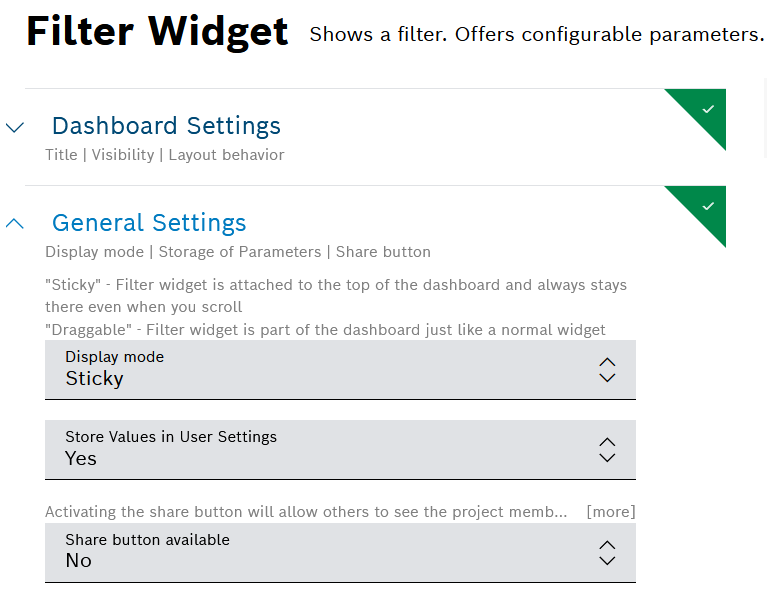
- Keep the default values and especially the Sticky Display mode in order to have the filter widget always on top of the dashboard even when scrolling:
- In the Filter Types section:
- Activate the toggle for General Filters. Later you can use these general filters as a reference in the other widgets.
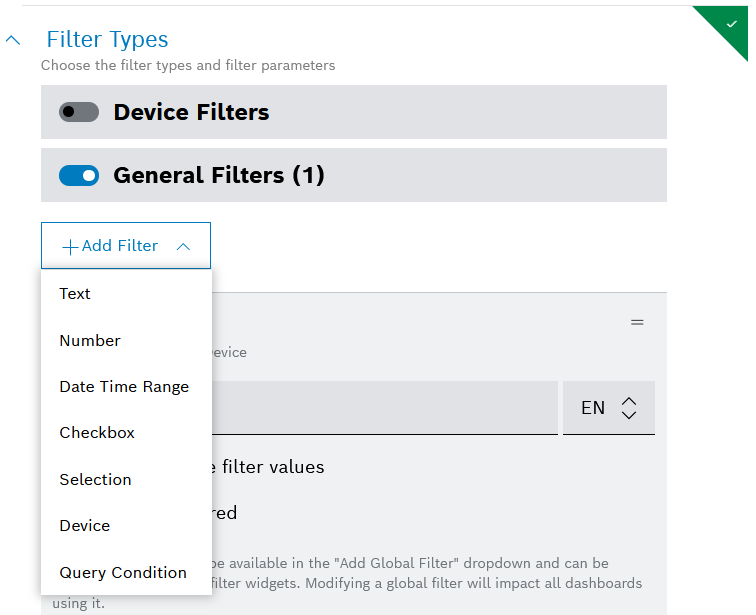
- Activate the toggle for General Filters. Later you can use these general filters as a reference in the other widgets.
- Click the Add filter button and select Device from the drop down list.
- Add a Display Name.
- In the Device types to be visible field, expand the drop-down menu and select the device type which you created in the early steps of this tutorial, i.e. in Device types and devices.
- In the Default Value field, select a default device for the filter. It means that when the dashboard is first loaded, it will show data filtered for this device.
- In the Value Path field, do not enter any value, as in that case the filter will use the
thingIdof the device.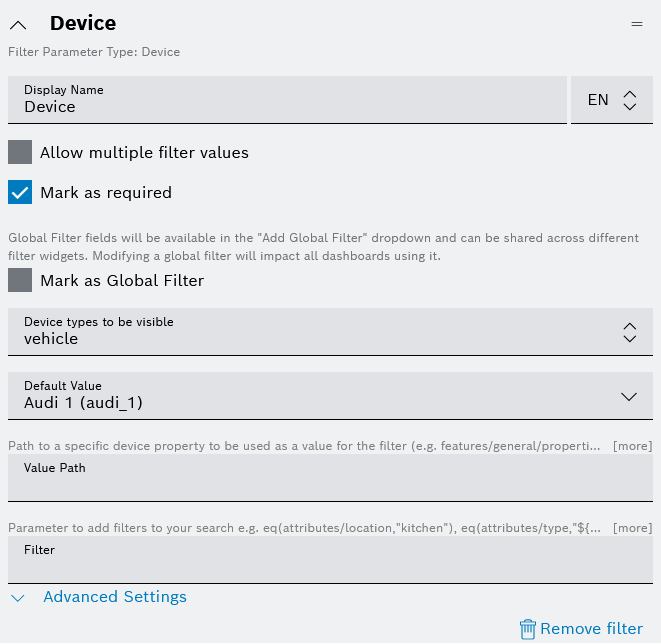
- Click the Add filter button and select Date Time Range from the drop down list.
- Add a Display Name and you can keep the rest of the settings as they are or adjust them as needed.
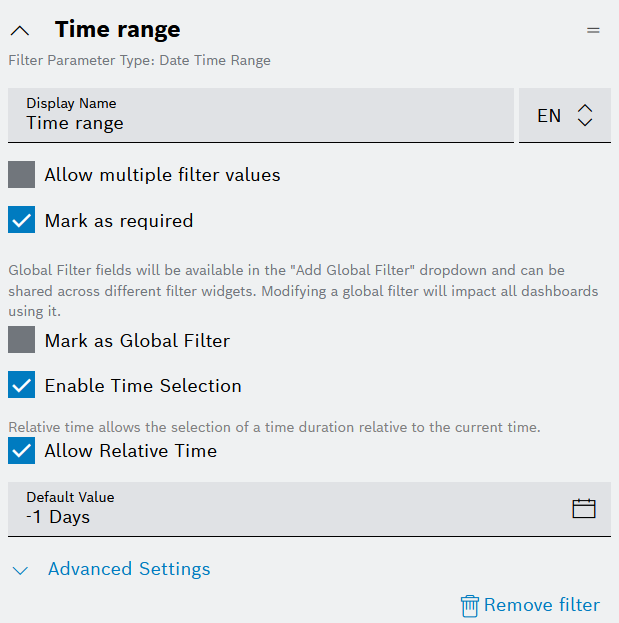
- Add a Display Name and you can keep the rest of the settings as they are or adjust them as needed.
- When ready, click the Add button on the bottom.
- The filter widget will appear on the top of the dashboard and you can change the values from the drop-down menu.
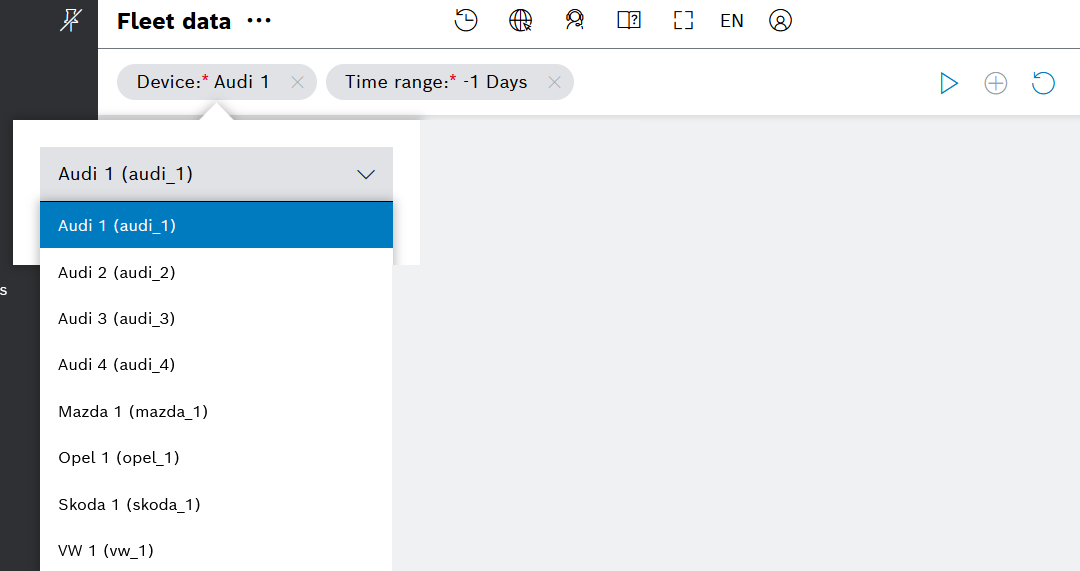
When you select a different value and you want to apply the changed filter to all the other widgets on the dashboard, do not forget to click the
 Apply filters button on the header bar.
More details about the filter widget are available in the User Guide at Filter widget.
Add a Line Chart widget for the fuel data
Let's continue with a Line Chart widget.
- Go again to the dashboard options, click the Add widget option, and in the Charts category select the Line widget.
- In the configuration editor that opens, fill in the required details in each section.
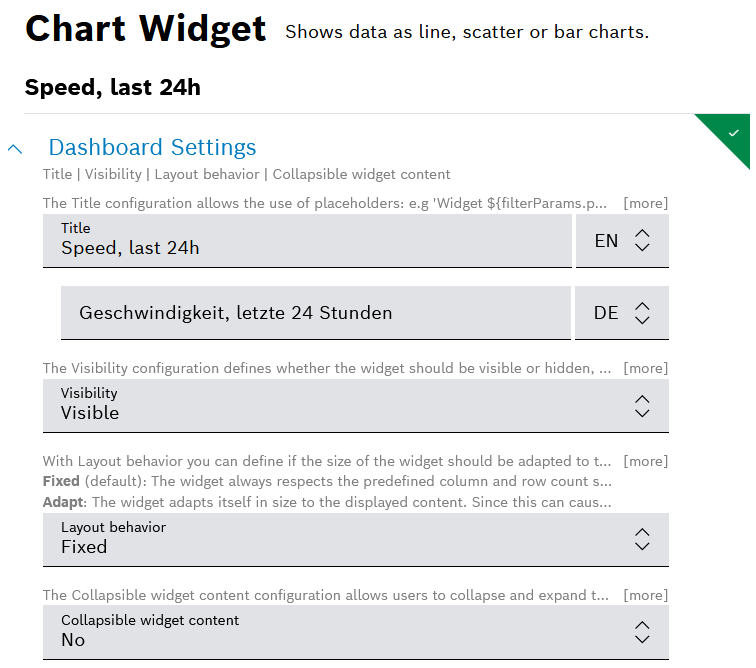
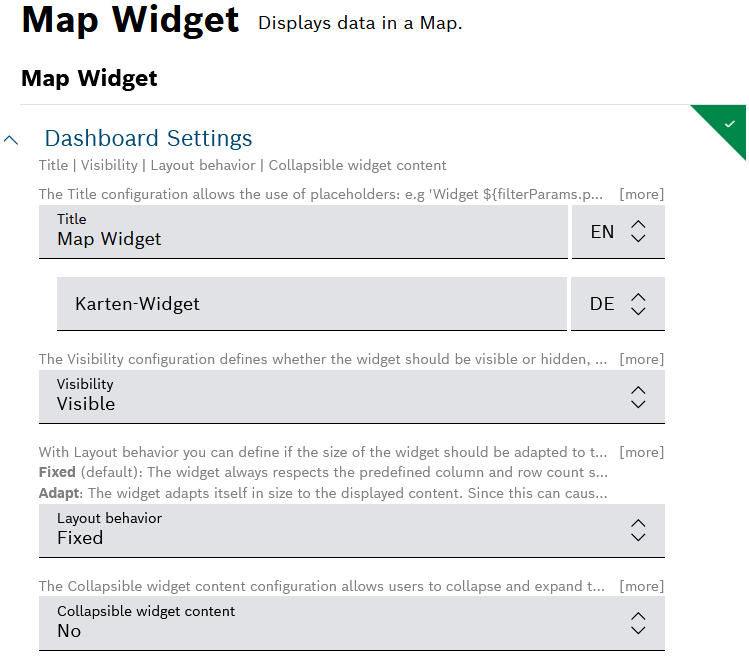
- Fill in the Dashboard Settings:
- For example, you can add a Title in English (EN) and German (DE), and you can keep the default settings for the rest of the fields.
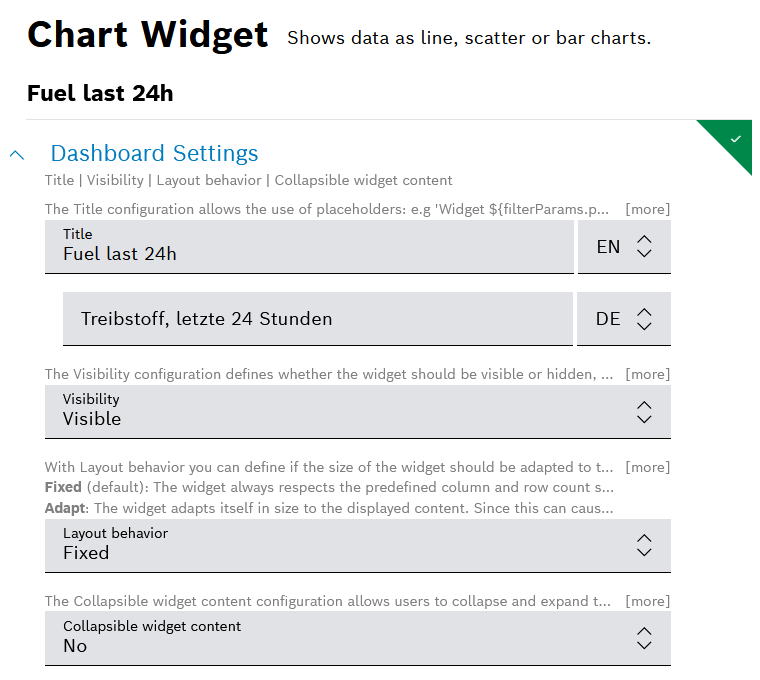
- For example, you can add a Title in English (EN) and German (DE), and you can keep the default settings for the rest of the fields.
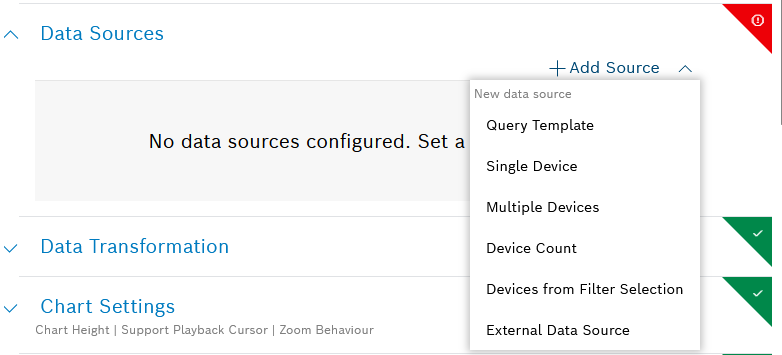
- In the Data Sources section define a data source:
- Click Add Source on the right and select the Query Template option.
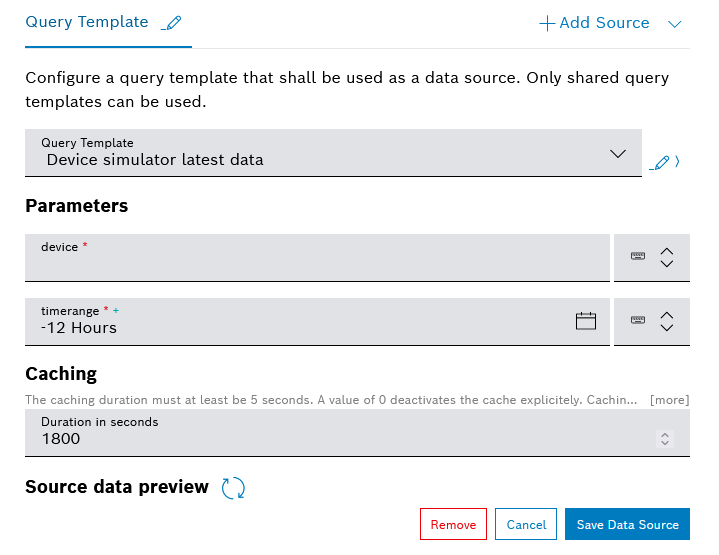
- Then in the Query Template field, use the dropdown menu and select the query template which we created in the previous steps, namely in Query template settings.
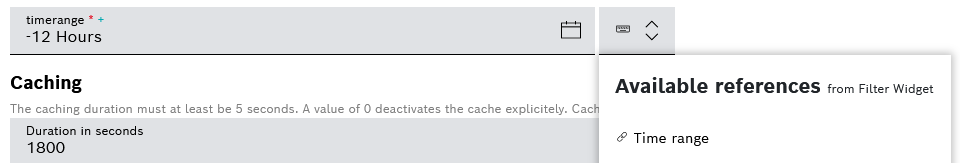
- In the Parameters area, select a reference to the global filters from the Filter widget, which will serve as values for the parameters of the query template data source:
- For the device parameter of the query template data source, click the drop down menu and select
 Device (ThingId).
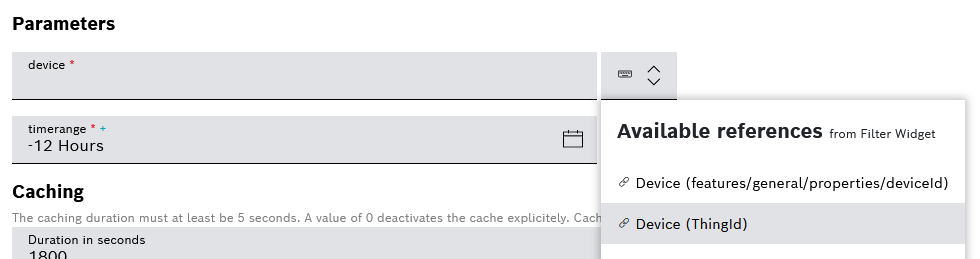
- For the timerange parameter of the query template data source, click the dropdown menu and select Time range.
- For the device parameter of the query template data source, click the drop down menu and select
- When ready, do not forget to click the Save Data Source button.
- Click
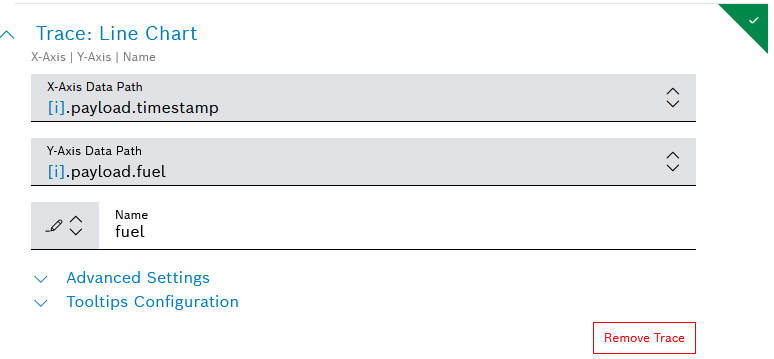
- In the Trace: Line Chart section:
- In the X-Axis Data Path field, expand the dropdown menu and select
[i].payload.timestamp - In the Y-Axis Data Path field, expand the dropdown menu and select
[i].payload.fuel - In the Name field, a name for the trace.
- In the X-Axis Data Path field, expand the dropdown menu and select
- Fill in the Dashboard Settings:
- When ready, click the Add button on the bottom.
More details about the Line Chart widget are available in the User Guide at Line Chart widget.
Add a Line Chart widget for the speed data
Likewise, we will create another Line Chart widget.
- On the dashboard options, click the Add widget option and in the Charts category select the Line widget.
- In the configuration editor that opens, fill in the required details in each section.
- Fill in the Dashboard Settings:
- For example, you can add a Title in English (EN) and German (DE), and you can keep the default settings for the rest of the fields.
- For example, you can add a Title in English (EN) and German (DE), and you can keep the default settings for the rest of the fields.
- In the Data Sources section configure the data source in the same way as for the previous line chart widget:
- Click Add Source and select the Query Template option.
- In the Query Template field, select the query template which you create in the previous part of this tutorial, namely Query template settings.
- In the Parameters area, add a reference for the device parameter and the timerange parameter of the query template data source:
- In the device field, expand the dropdown menu and select Device (ThingId).
- In the timerange field, expand the dropdown menu and select Time range.
- In the device field, expand the dropdown menu and select
- When ready, do not forget to click the Save Data Source button.
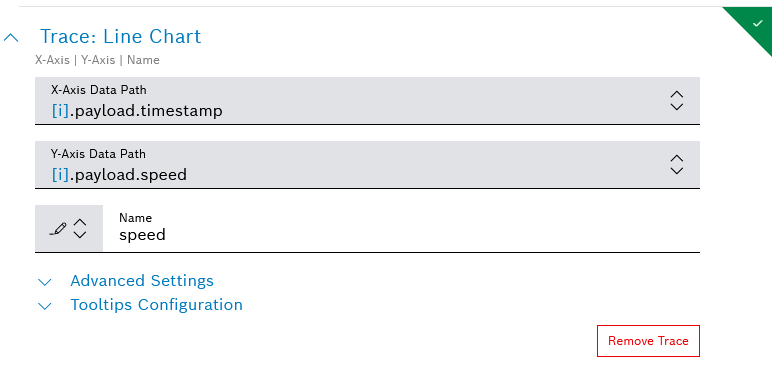
- In the Trace: Line Chart section:
- In the X-Axis Data Path field, expand the dropdown menu and select
[i].payload.timestamp - In the Y-Axis Data Path field, expand the dropdown menu and select
[i].payload.speed - In the Name field, a name for the trace.
- Fill in the Dashboard Settings:
- When ready, click the Add button on the bottom.
More details about the Line Chart widget are available in the User Guide at Line Chart widget.
Add a Tour Map widget
- On the dashboard options, click the Add widget option and select Tour Map widget.
- In the configuration editor that opens, fill in the required details in each section.
- Fill in the required fields in the Dashboard Settings section:
- In the Data Sources section define a data source in the same way as described above for the two line chart widgets.
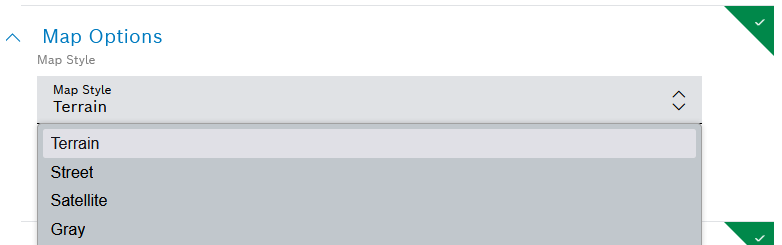
- In the Map Options section, select a map style:
- In the Trace: Tour section, define the latitude and longitude:
- In the Latitude field, expand the dropdown menu and select
[i].payload.position.lat - In the Longitude field, expand the dropdown menu and select
[i].payload.position.long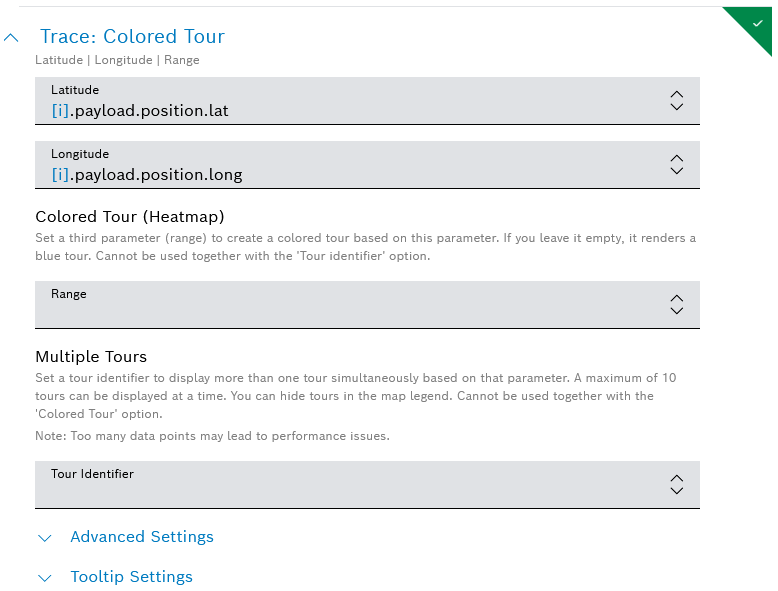
- In the Latitude field, expand the dropdown menu and select
- Fill in the required fields in the Dashboard Settings section:
- When ready, click the Add button on the bottom.
More details about the Tour Map widget are available in the User Guide at Tour Map widget.
Add a Rich Text widget
With this widget, you can display formatted text and other content.
- On the dashboard options, click the Add widget option and select Rich Text widget.
- In the configuration editor that opens, fill in the relevant details in each section.
- In the Dashboard Settings section, optionally provide a Title for the widget.
- In the Data Sources section, define a data source in the same way as described above for the two line chart widgets. In particular:
- Add a source of the query template type and select the query template which was created in the previous part of this tutorial, namely Query template settings.
- In the Parameters area, add the corresponding references from the filter widget: Device (ThingId) for the device parameter, and Time range for the timerange parameter.
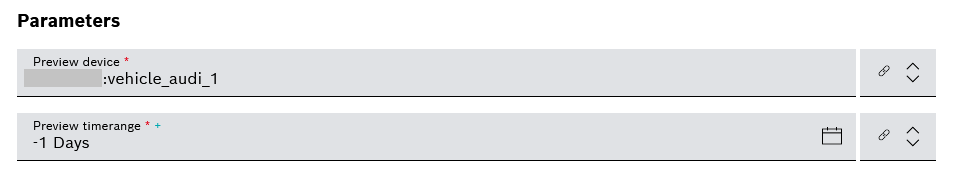
- In addition, you may also need to add manually a Preview device in order for the widget to load the initial data.
- When ready, do not forget to click the Save data source button.
- In the Rich Text Settings section, you can try out working with the placeholder values as shown on the screenshot.
For example, add the following:Device:
filterParams.deviceErrors:
[i].payload.errorsProcessed at:
[i].metaData.processedAt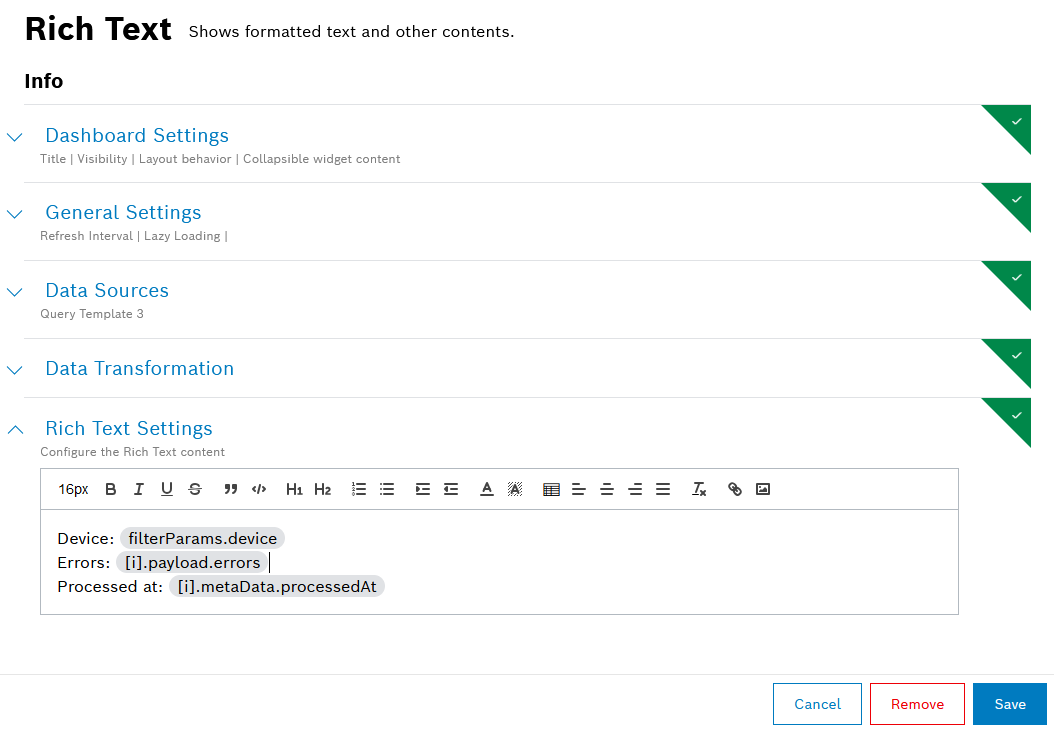
Here is a hint: you can type
${to open the list of the available placeholders based on the data source. See an example: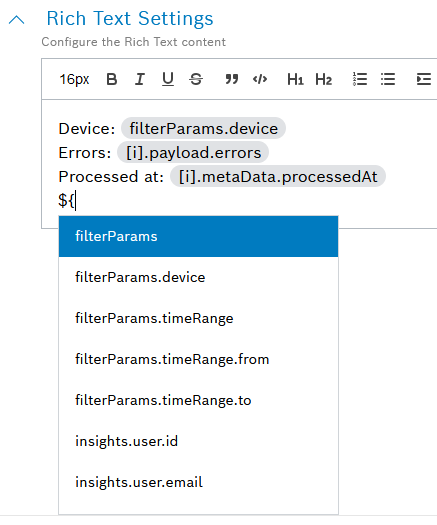
- When ready, click the Add button on the bottom.
Add a Device Details widget
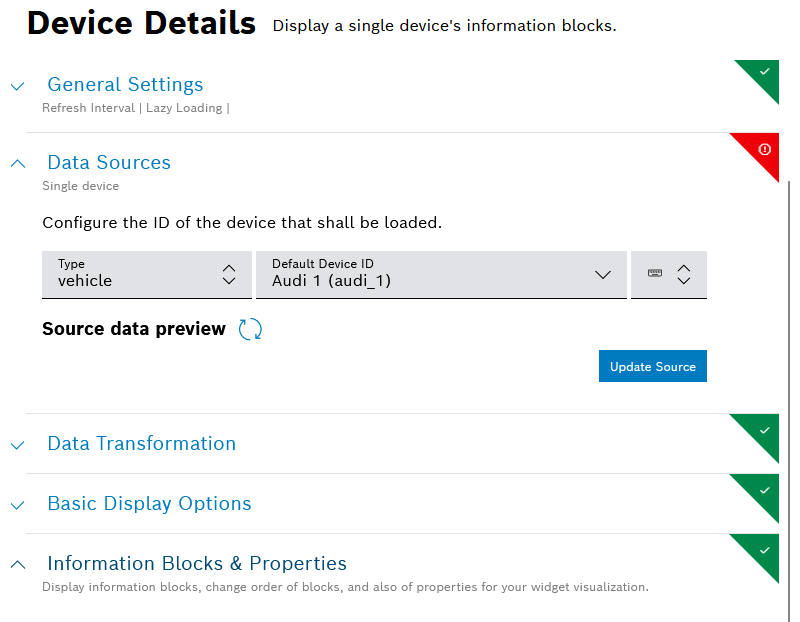
With this widget, you can display data from the information blocks of a single device.
- On the dashboard options, click the Add widget option and select Device Details widget.
- In the configuration editor that opens, fill in the relevant details in each section.
- In the Dashboard Settings section, optionally provide a Title for the widget.
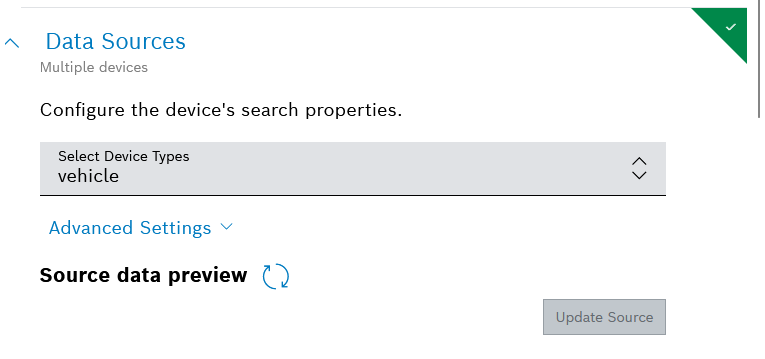
- In the Data Sources section, configure the ID of the device that shall be loaded.
In particular:- In the Type field, select the device type which we created in the first part of this tutorial (Device types and devices), namely
vehicle. - In the Default Device ID field, select one of the devices registered with the system, whose data should be displayed.
- In the
 Available references field, go to the area Available references from Filter Widget and select the option Device (ThingId).
 - Optionally, preview the data by clicking Source data preview
 .
. - When ready, click the Update Source button.
- In the Type field, select the device type which we created in the first part of this tutorial (Device types and devices), namely
- In the Information Blocks & Properties section, you can configure which information blocks of the device will be displayed in the widget, change the order in which they are displayed, and adjust some properties.
- Use the toggles and checkboxes to show and hide information in the widget.
- Use the
 drag and drop option for each block to achieve the desired order.
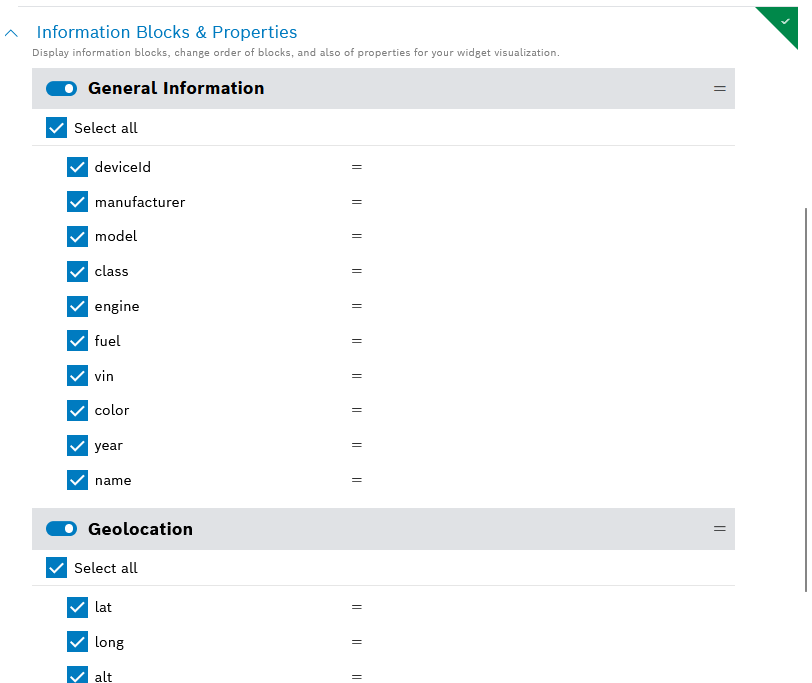
- When ready, click the Add button on the bottom.
To find out more about the widget's features, refer to Device Details widget in the User Guide.
Add a Calendar widget
You can use the calendar widget to display all relevant bookings of your devices in one place.
Normally, a calendar widget is added on a separate dashboard. To create a new dashboard for the calendar widget, follow the steps from the beginning of this page, in the Create a dashboard section.
Then, proceed as follows:
- On the dashboard options, click the Add widget option and select Calendar widget.
- In the configuration editor that opens, fill in the required details in each section.
- In the Dashboard Settings section, optionally provide a Title for the widget.
- In the Data Sources section, you will see different configuration fields depending on whether there is a filter widget on the same dashboard or not. Here, simply select the device type of interest.
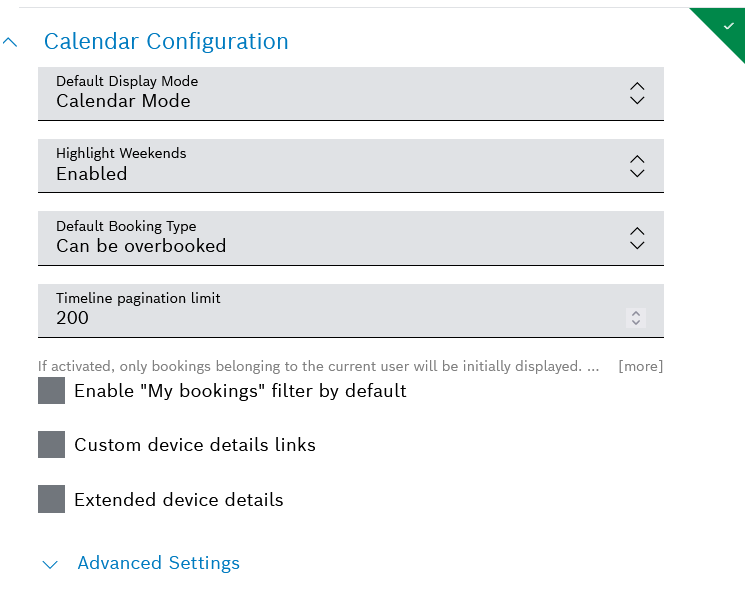
- In the Calendar Configuration section, keep the default settings or try out the different display modes, filtering, details, etc.
- When ready, click the Add button on the bottom.
- Upon that, your calendar widget is ready. Try and create a new booking through the Create Booking button on the top right, and then expand the booking to see its details:
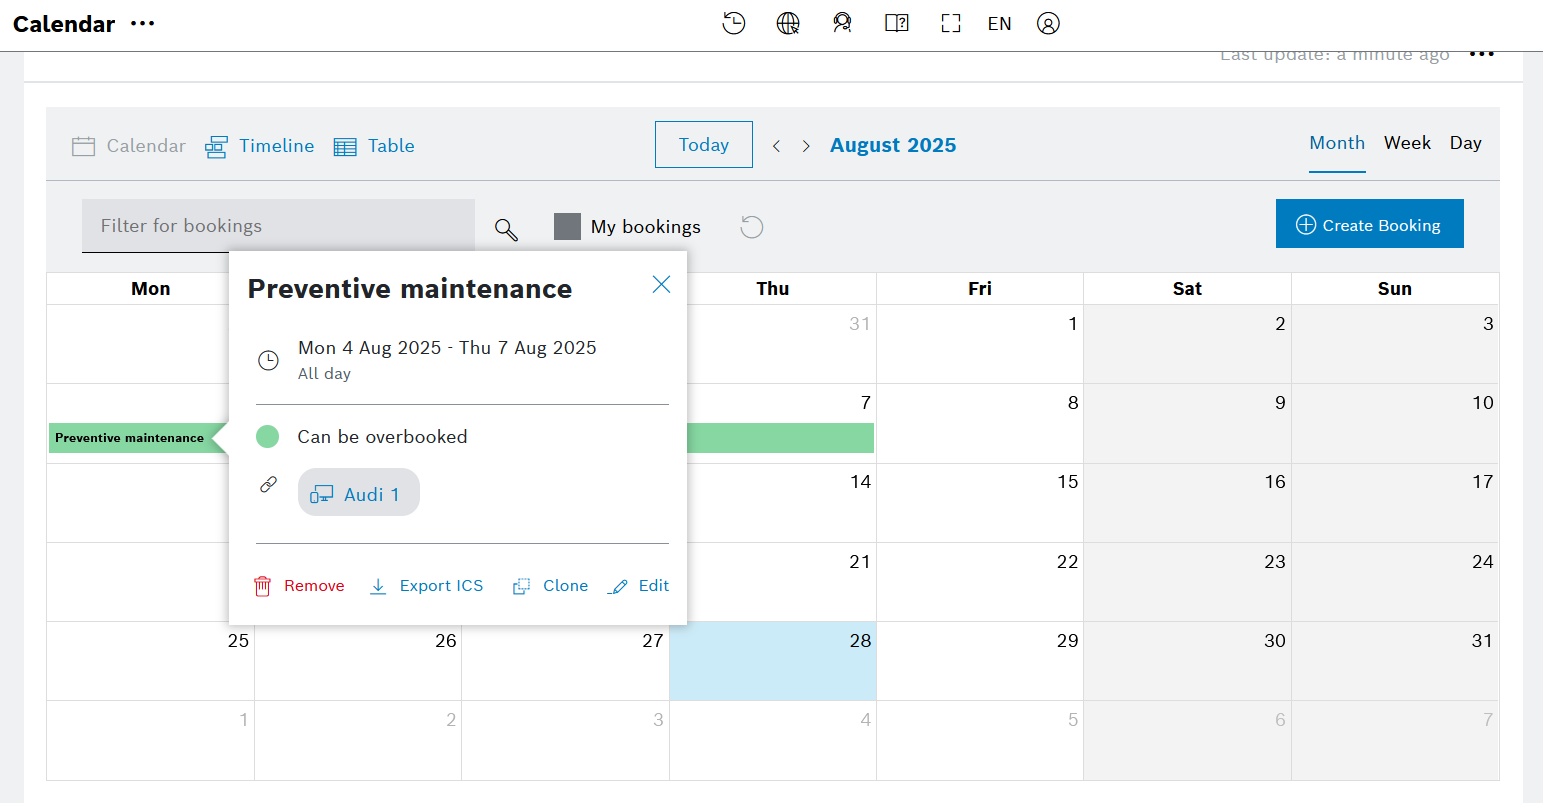
As the calendar widget offers quite a lot of features, including various layouts and filtering options, we invite you to check them at Calendar widget in the User Guide.
Arrange the widgets on the dashboard
Now that your dashboards are added, you can play with the layout.
Proceed as follows:
- Go to the dashboard options menu and select Rearrange.
- Use the various available options to reach the desired view, in particular:
- Zoom in and out, using the relevant icons on the header bar, to see the whole dashboard or a particular part of it
- Drag and drop widgets
- Resize widgets using the arrows in the corners or on the sides
- Undo and redo the layout changes
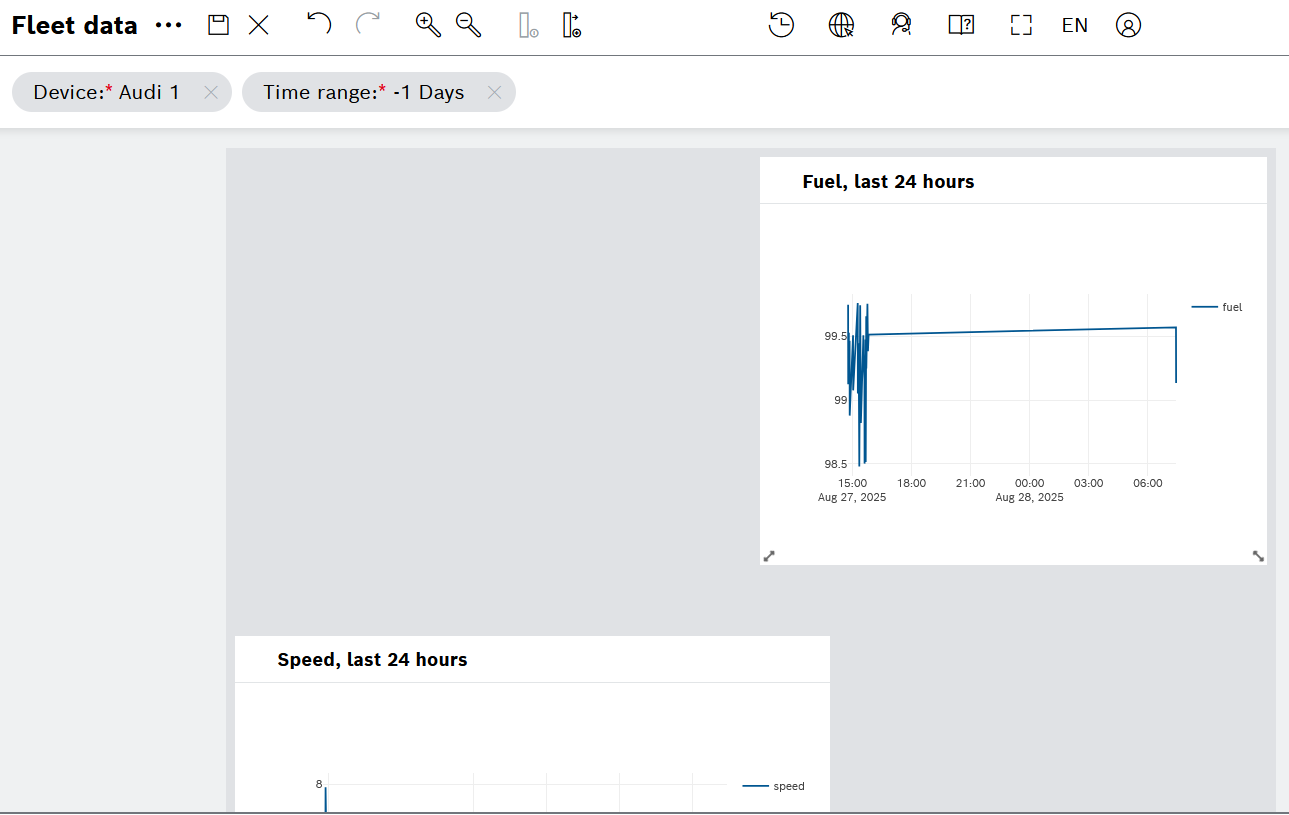
- When ready, click the
 save icon on the header bar to save the layout changes.
Find full details in the User Guide at Arranging widgets in the grid-based layout